13 Jan 2015
Goal
Design a boat capable of navigating a 3 meter by 6 meter pool without human intervention or control, while maximizing the value of speed (i.e lap time) squared divided by mass. The dimensions of the vehicle were constrained to be able to fit into a cube of 30 cm.
Electronics
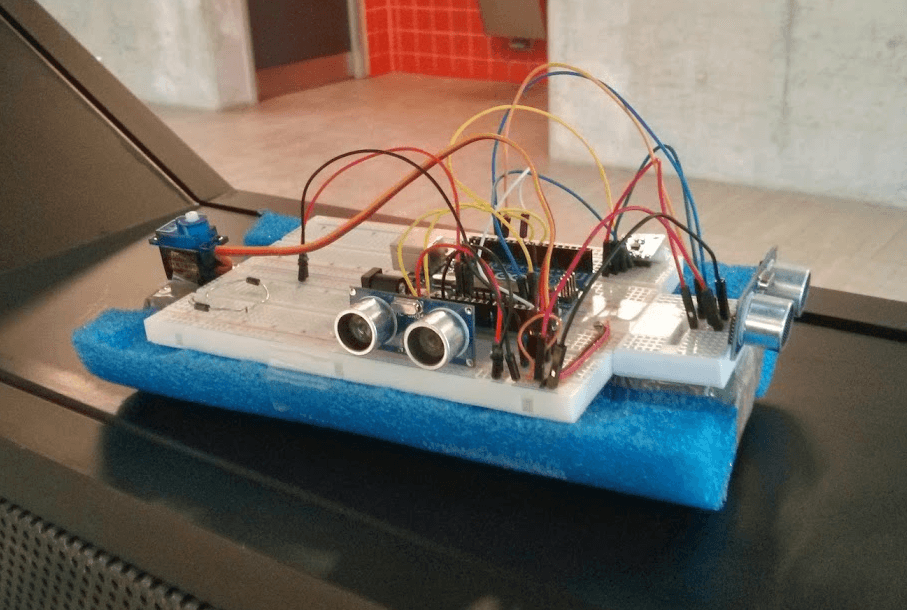
The first thing our team did was build a test platform (shown below) in order to test our electronics. Obstacles avoidance was accomplished using a combination of IR range sensors and ultrasonic sensors, and a compass/gyro for determining the orientation of the boat during manoeuvers. The test platform used a single small motor and a rudder for propulsion and steering.
Prototype
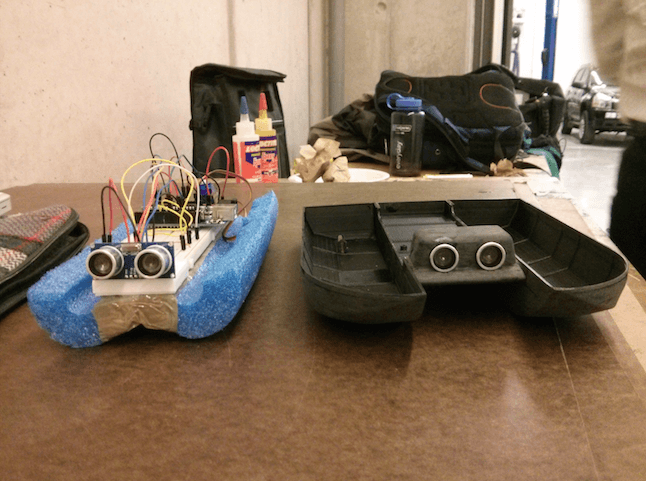
With functioning electronics, we constructed a new prototype with a catamaran twin-hull design and a dual motor differential steering system. The second prototype was 3D printed, sanded and then coated with varnish for waterproofing. The photo below shows a comparison of the two platforms:
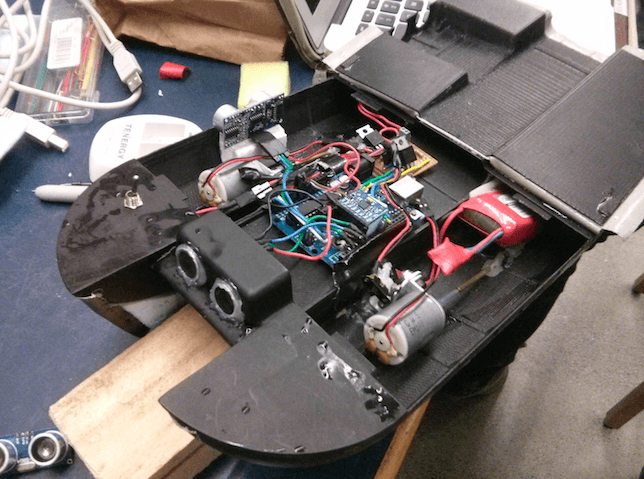
After the catamaran hull was ready to go, the electronics were transferred over and the second motor was added:
Results
What resulted was a machine bred purely for speed… in a straight line. While our boat was without a doubt the fastest in a drag race, our design had some serious oversights. Because of its extremely low profile, the sensors would sometimes confuse the waves caused by the boat’s wake for the wall of the pool. The only way for our boat to complete the course was to reduce speed significantly, to about a third of its maximum. We ended up 6th out of 36, a disappointing finished for us.
The whole point of this class was to learn about the design process and I can wholeheartedly say that I learned many things, usually the hard way.
- High and dry is a good way for sensors to be. Or waterproof.
- Compasses are only as good as the magnetic field they’re in.
- Decouple everything. Electrons are fickle.
- Design for manufacturing, assembly and repairs - someone has to do all three.
- A timely wrong decision is better than no decision.
11 Jan 2015
The Goal
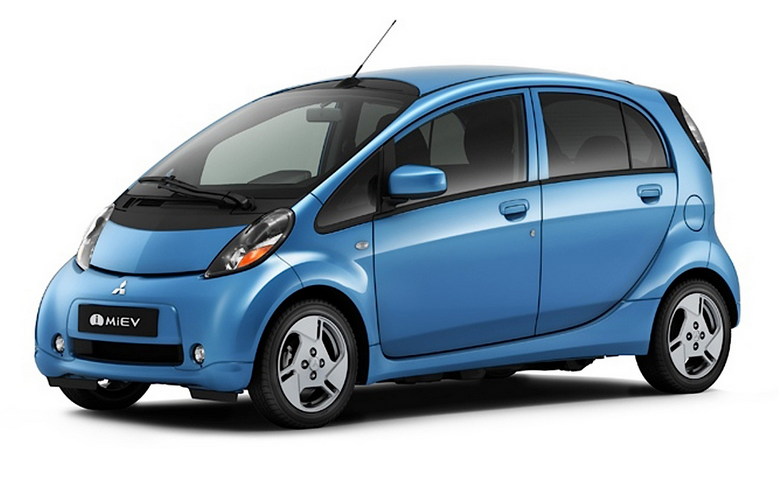
Real-time mass estimation was one of my projects during my coop term in Singapore. The goal of the project was to use CAN bus signals to estimate the mass of an electric vehicle (the Mitsubishi iMiEV, seen below) in real time, without augmenting the vehicle with any additional sensors. Accurate mass estimates can be used for numerous purposes, including fleet management and better range to empty estimates.
CAN Bus Signals
Modern vehicles have numerous sensors built in, including wheel encoders, torque sensors and electrical sensors. The challenge part is knowing which signal belongs to which sensor. All of the signals are transmitted using the same format, which can be seen in the figure below:
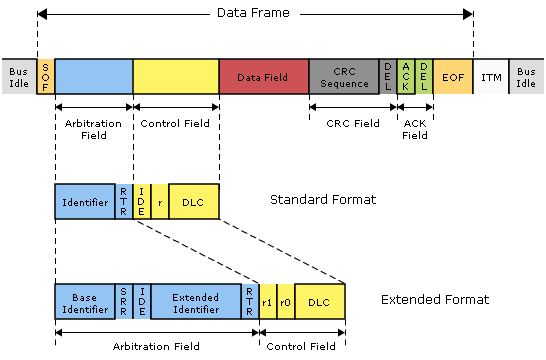
In order to figure out which signal corresponed to which sensor, I wrote a program to parse the incoming CAN bus messages and plot the signals in real time. The driving data was also logged so that it could be analyzed after the fact. After a week or two of testing, analysing and confirming hypotheses, the signals corresponding to the each of the wheel encoders, the motor torque, velocity were identified.
The Model
In order to use the Kalman filter for vehicle state estimationm, I needed to come up with equations to describe the state dynamics through time. Basically, the torque from the motor can be propogated through the drivetrain to become force acting at the wheels, which serves drive the vehicle forward. Opposing the wheel force are friction and aerodynamic resistance. Additionally, the wheel encoders can be used to determine the actual distance travelled by the wheels over the interval between measurements.
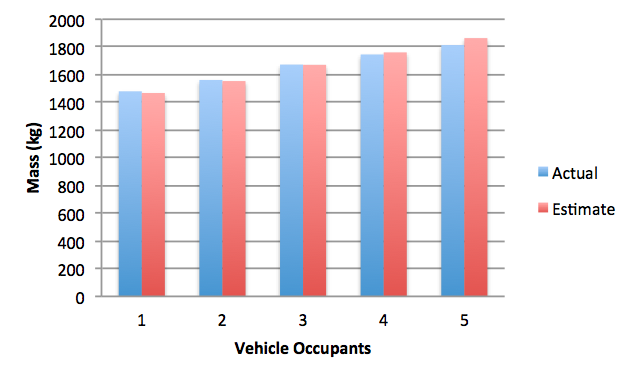
By comparing the torque output by the motor to the actual change in vehicle velocity over an interval, an estimate can be produced for the mass of the vehicle and its occupants and cargo.
The Experiment
The test track consisted of a level straightaway approximately 75 metres in length, as shown below:
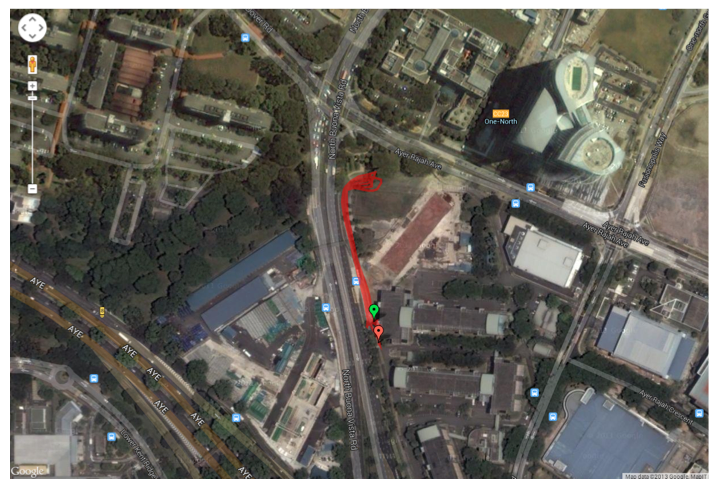
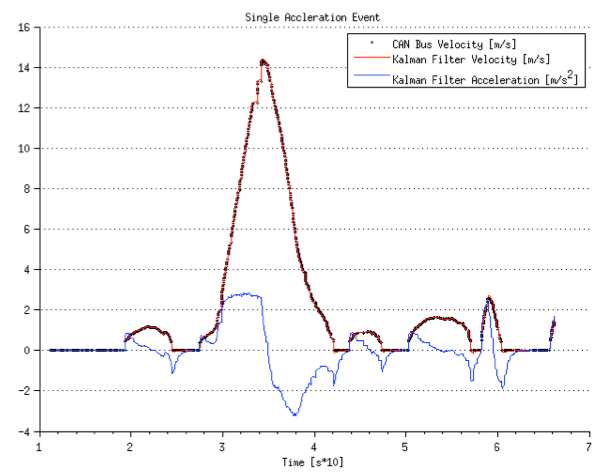
The testing procedure used one driver, with four passengers to vary the vehicle mass. Initially without passengers, the driver accelerated down the straightaway, braked, performed a three point turn, and accelerated back to the initial position, braking once more. Each time this sequence was executed, an additional passenger would enter the vehicle, until all four passengers where on board for the last run. The speed profile of a single section can be seen below:
Using the methodology discussed above, the average absolute error for the five runs was 1.0%, with the largest error being 2.7%. This means that in the average case, the estimated mass of the vehicle, passengers and cargo was accurate within 14 kilograms.
My experience in Singapore left me with a deep appreciation for electric vehicles and the enormous potential that they offer. The rate of innovation in this field is absolutely staggering, and I find the possibility of being a part of it truly exciting.
10 Jan 2015
This project was also part of the Numerical Control of Machine Tools (ME548) course that I took last semester. The goal of the project was to develop a mathematical model for a 2-fluted end-mill in order to simulate the forces developed under different cutting conditions.
Experimental data was collected using a dynamometer for four test cases. The spindle speed, feed rate and axial depth of cut were all kept constant, while the radial depth of immersion was varied. The four immersion cases used were quarter immersion, half immersion, three-quarter immersion, and full immersion (slotting).
Orthogonal cutting coefficients were provided for 6061 aluminum, along with the relevant tool geometry (helix angle and rake angle). Using this information, I developed a model using Brown and Armarego’s cutting equations and Stabler’s chip flow rule and implemented it in MATLAB.
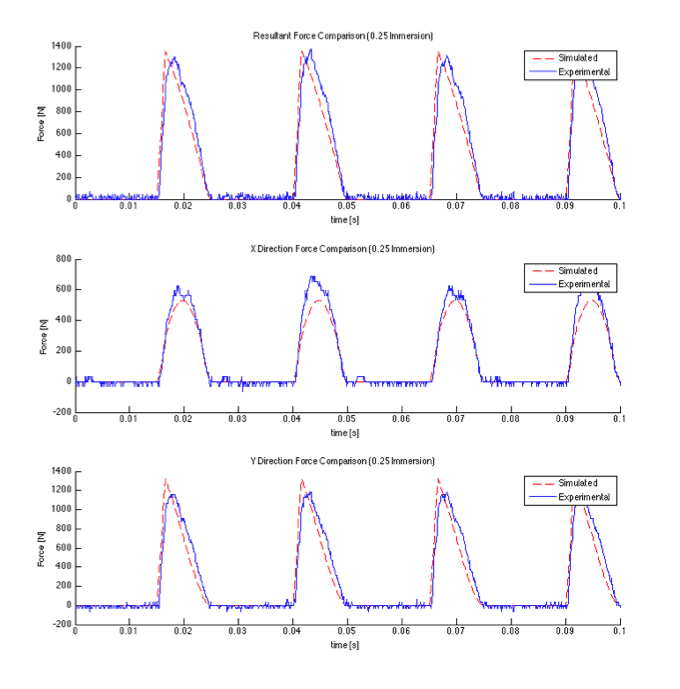
Once the bugs were eliminated from the MATLAB code, I simulated the four test cases and overlayed the simualation and experimental data for the X, Y and resultant forces. The plots for two of the test cases can be seen below:
Quarter Immersion:
Three-quarter Immersion:
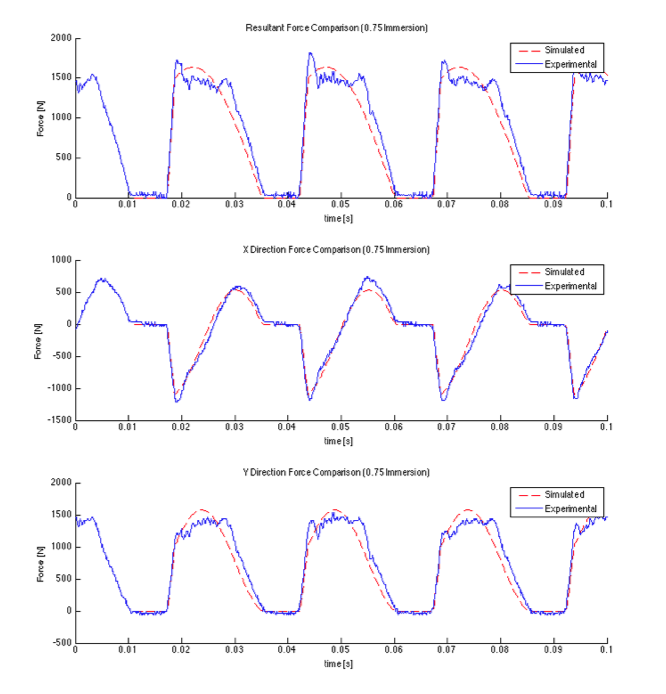
Both plots show that the simulation captures the behaviour of the end mill quite accurately. Ignoring measurement and vibrational noise, the discrepancy between the curves comes from tool wear which distorts the force profile for the experimental data. In fact, the predictive model can be used as a indicator of just how worn the particular tool is, and even whether it needs to be replaced.
One thing I found particularly interesting (although unsurprising) was the comparison between the different cutting cases. The plot below shows all four cases overlaid and aligned:
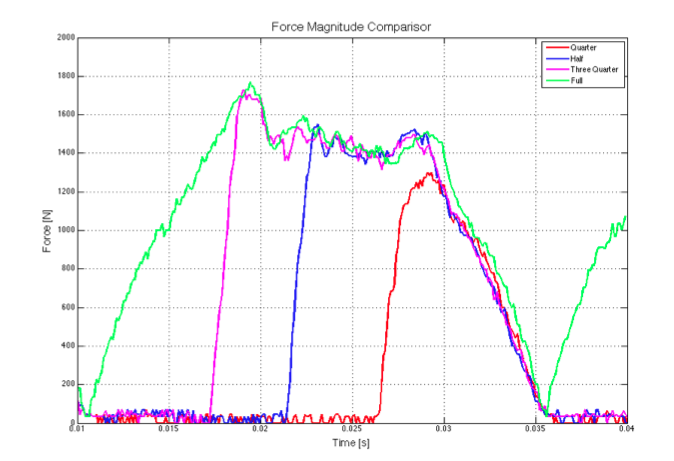
Because the same tool was used for each of the cutting cases, each one produces an almost identical force profile during the part of the cycle in which a tooth is engaged. Very cool.
03 Nov 2014
This was an assignment for the Autonomous Mobile Robotics (ME597) course I’m taking. Given the vehicle shown below, I needed to come up with a motion model and then use simulated multi-rate GPS data to estimate the state of the vehicle as it executed various paths.
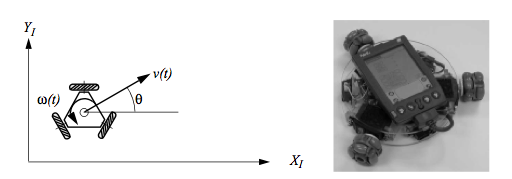
The reason that the extended version of the Kalman Filter was used is that the wheel speeds affect the position of the vehicle in the intertial reference frame in different ways depending on the heading. Thus, the motion update equations are linearized about the current belief of the vehicle’s heading.
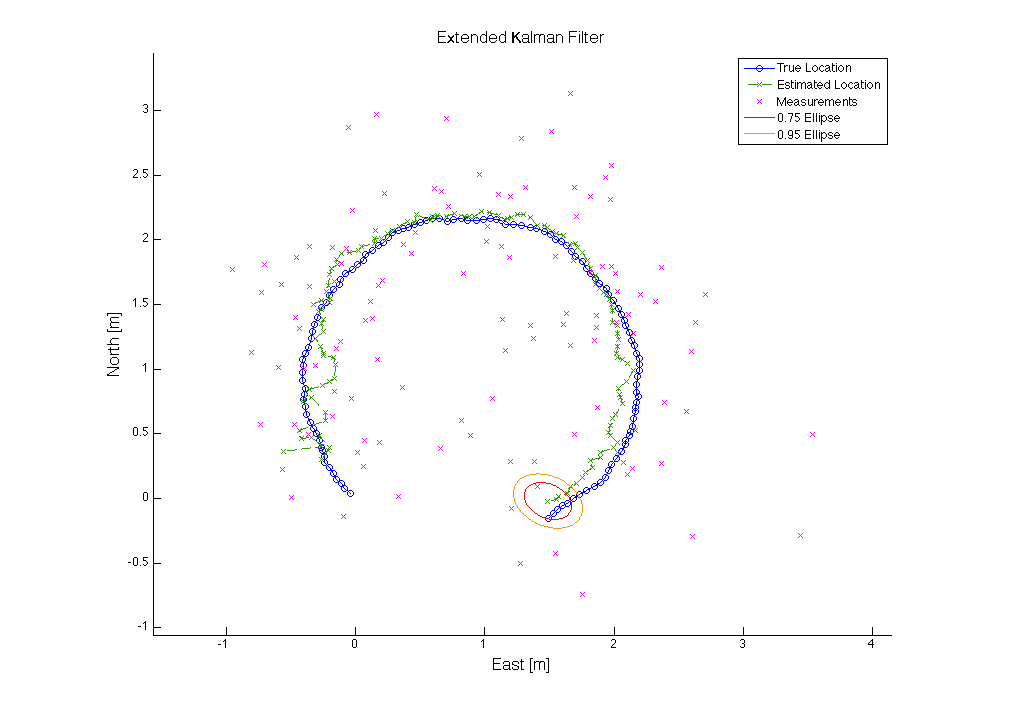
Low accuracy GPS data (standard deviation of 0.5 meters North and East) was received at 10 Hz, with more accurate measurements (standard deviation of 0.01 meters North and East) occuring at a rate of 1 Hz. A magnetometer with a standard deviation of of 10 degrees was used to provide information about the vehicle’s heading.
The following figure shows the actual vehicle path in blue, the estimated path in green, with measurements in magenta, using only the low accuracy GPS measurements for state estimation.
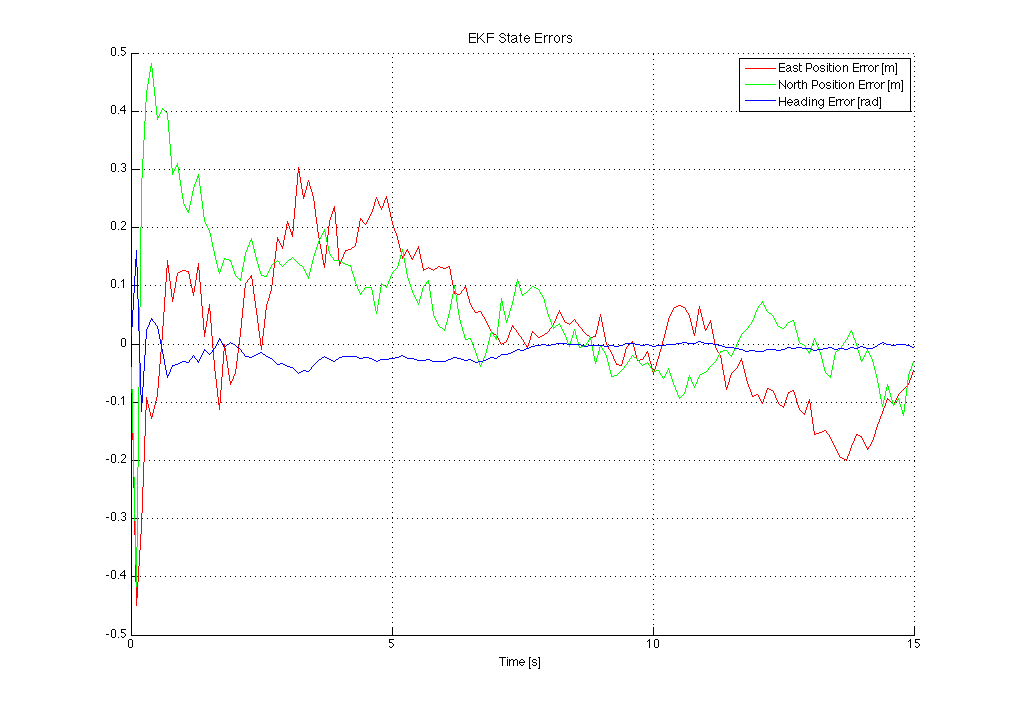
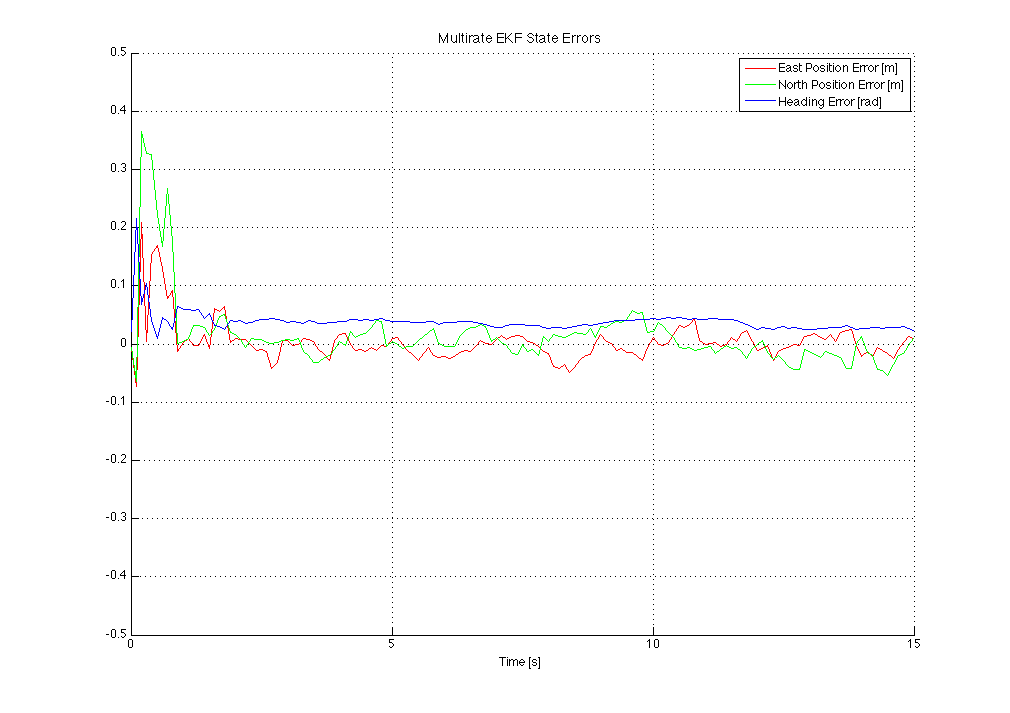
The errors on the each of the state variables are shown below.
This figure also shows the actual vehicle path in blue, the estimated path in green, with measurements in magenta, but uses the multi-rate GPS data for state estimation.
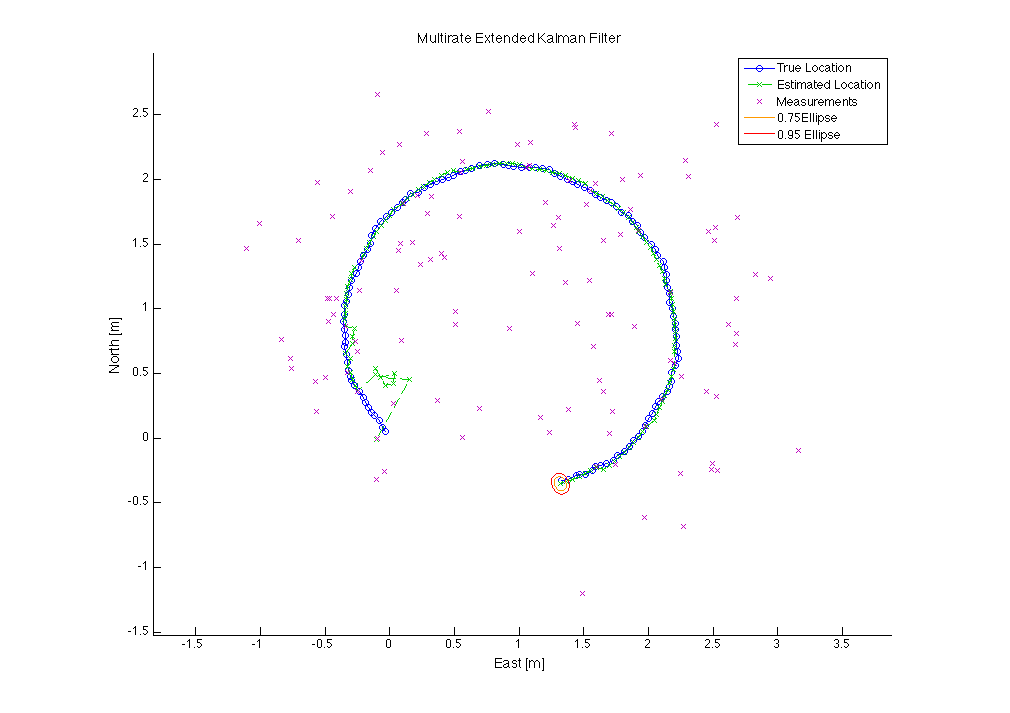
It can be observed that the errors are much lower when the multi-rate GPS data is used.
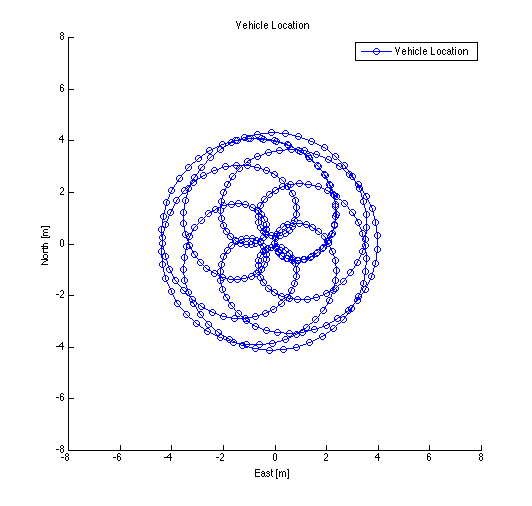
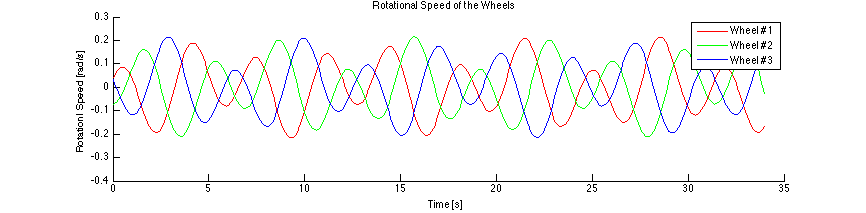
An additional requirement for the assignment was to come up with an inverse model in order to generate a variety of paths. The vehicle can only be controlled by adjusting the rotational speed of each of the three wheels, which is why the problem is not as trivial as simply specifying the desired velocity in the intertial coordinate frame.
Here is one of the paths generated in this way - an epicycloid. The wheel rotational speeds which produce the path are shown below.
This is definitely one of the most challenging courses I’ve ever taken, but it also ranks as one of the most interesting. The potential impact autonomous vehicles will have is of a magnitude only comparable to nanotechnology and artificial intelligence, so the possibility of playing a role in their development is an extremely exciting prospect for me.
02 Nov 2014
This project was part of the [Numerical Control of Machine Tools (ME548)](http://mme.uwaterloo.ca/~me548/) course that I'm taking right now.
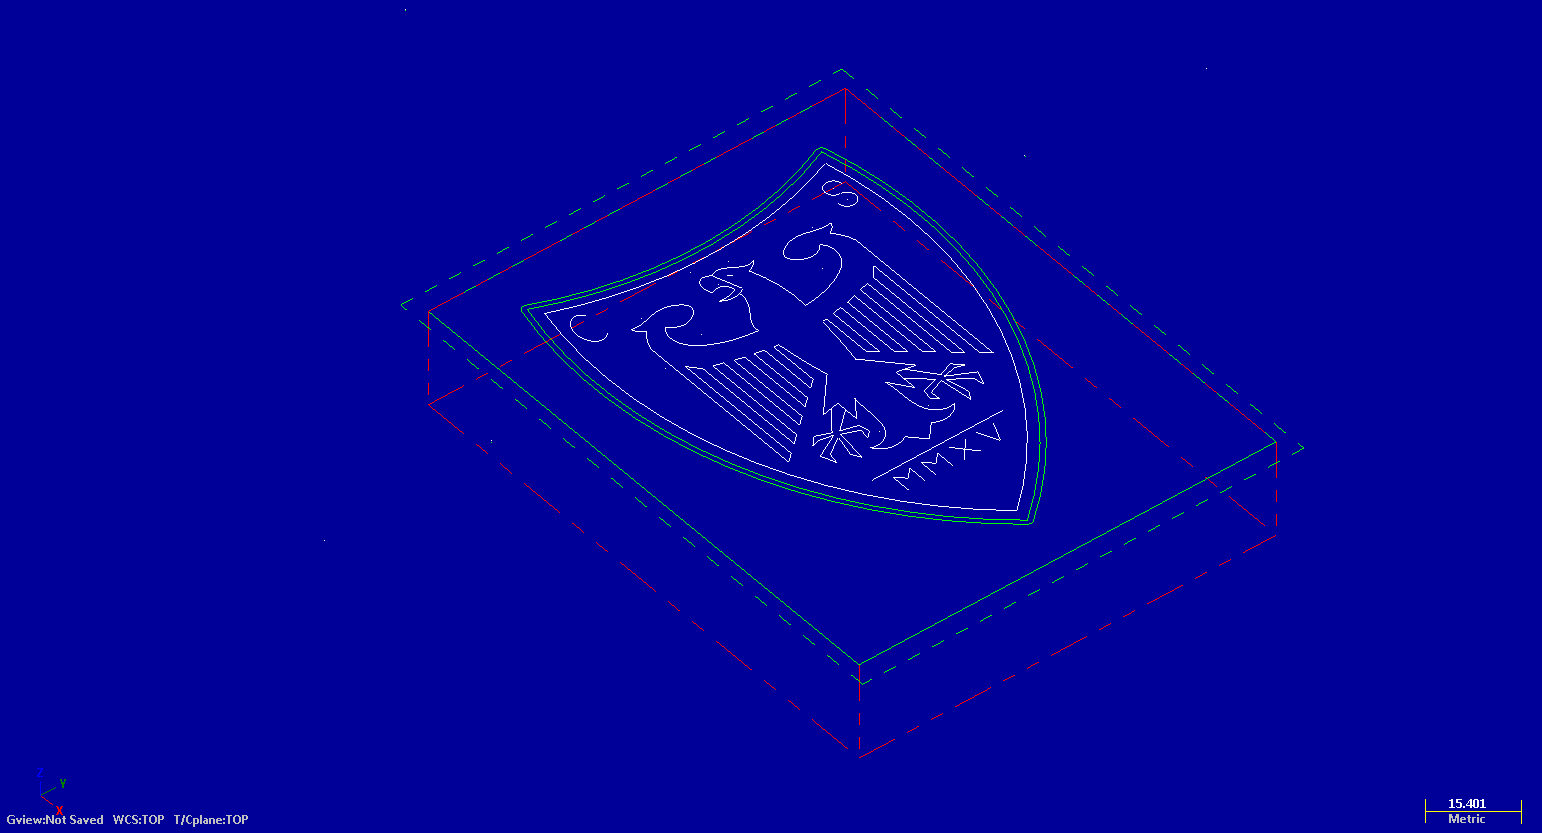
Given an aluminum blank and a technical drawing of the part (below), I needed to produce a crest with a custom engraving on the surface.
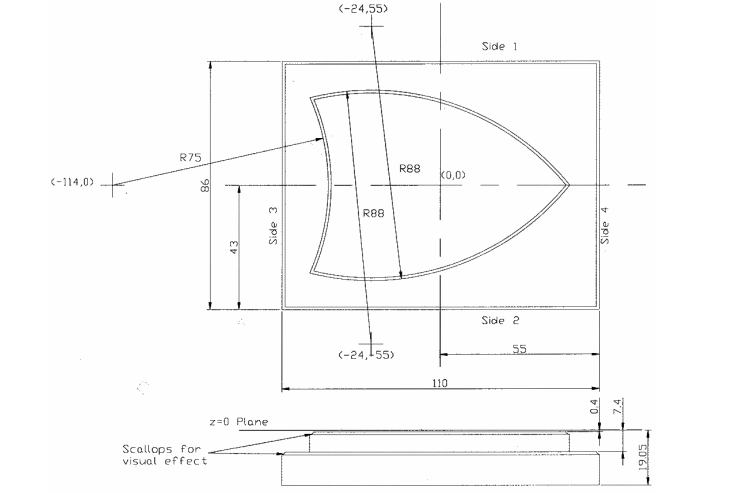
From the drawing, I made a model with all the crest geometry in MasterCAM. Here's what the model looks like:
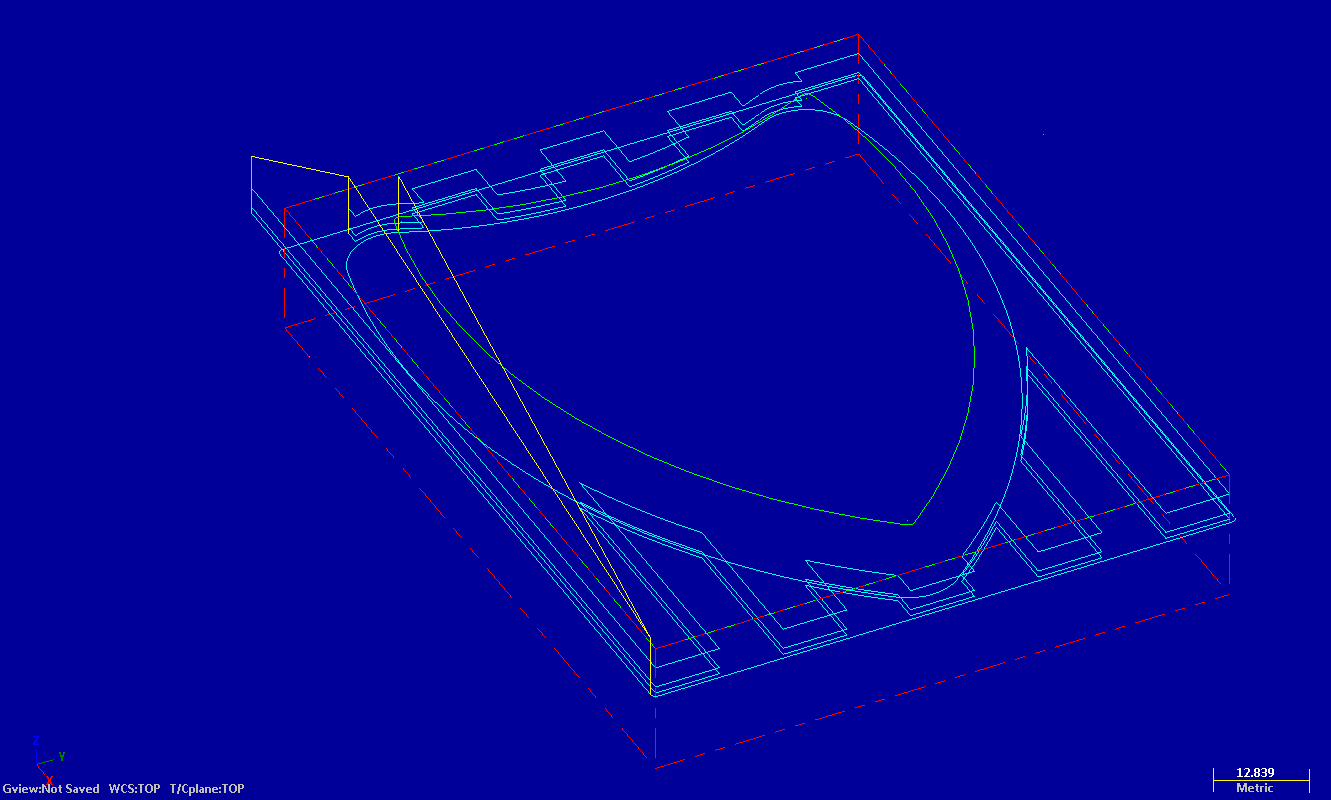
In order to actually machine the part I needed specify the toolpaths for the various operations, including contouring of the outer faces, the facing on the part surface, the engraving on the crest and the scallops to finish the part off. Here are some screenshots showing some of the more interesting toolpaths.
Removing material to form the crest island:
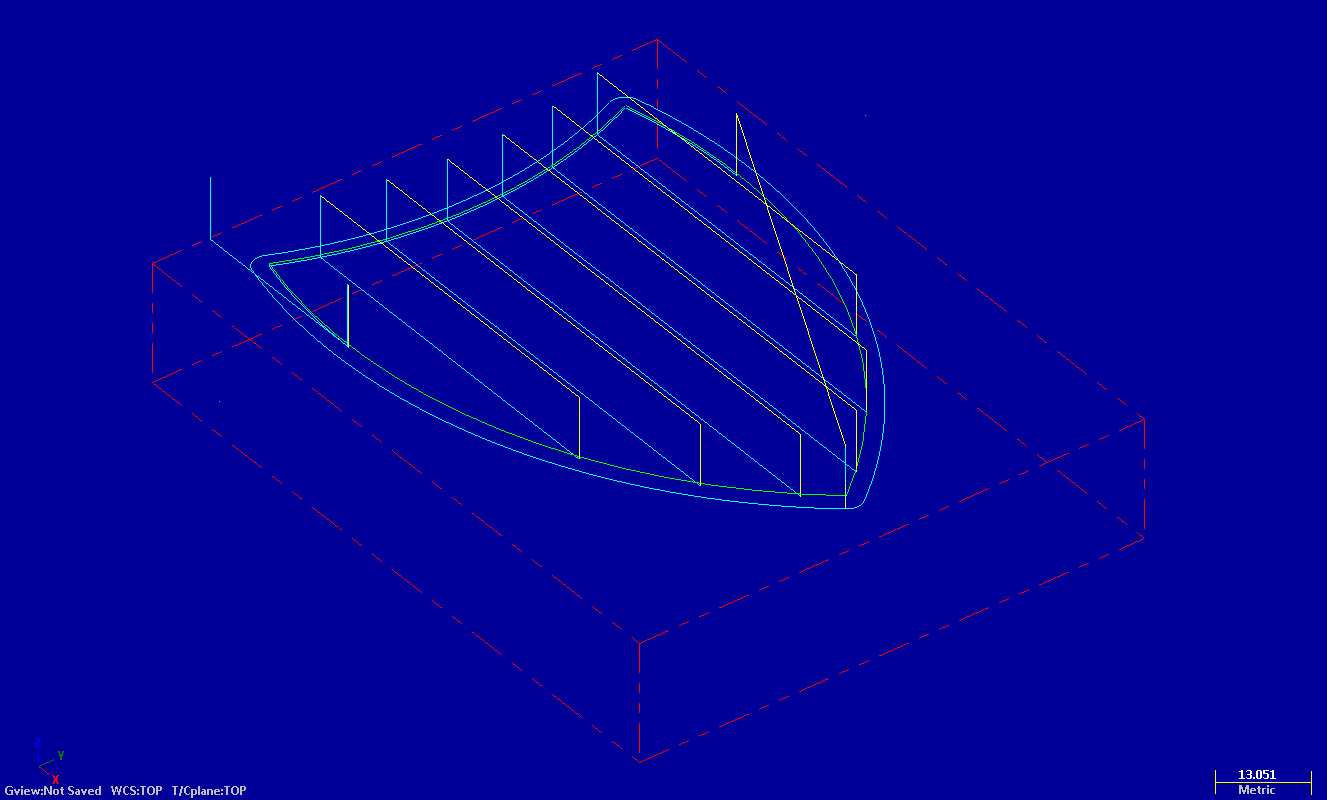
Skimming material off of the crest face to prepare for engraving:
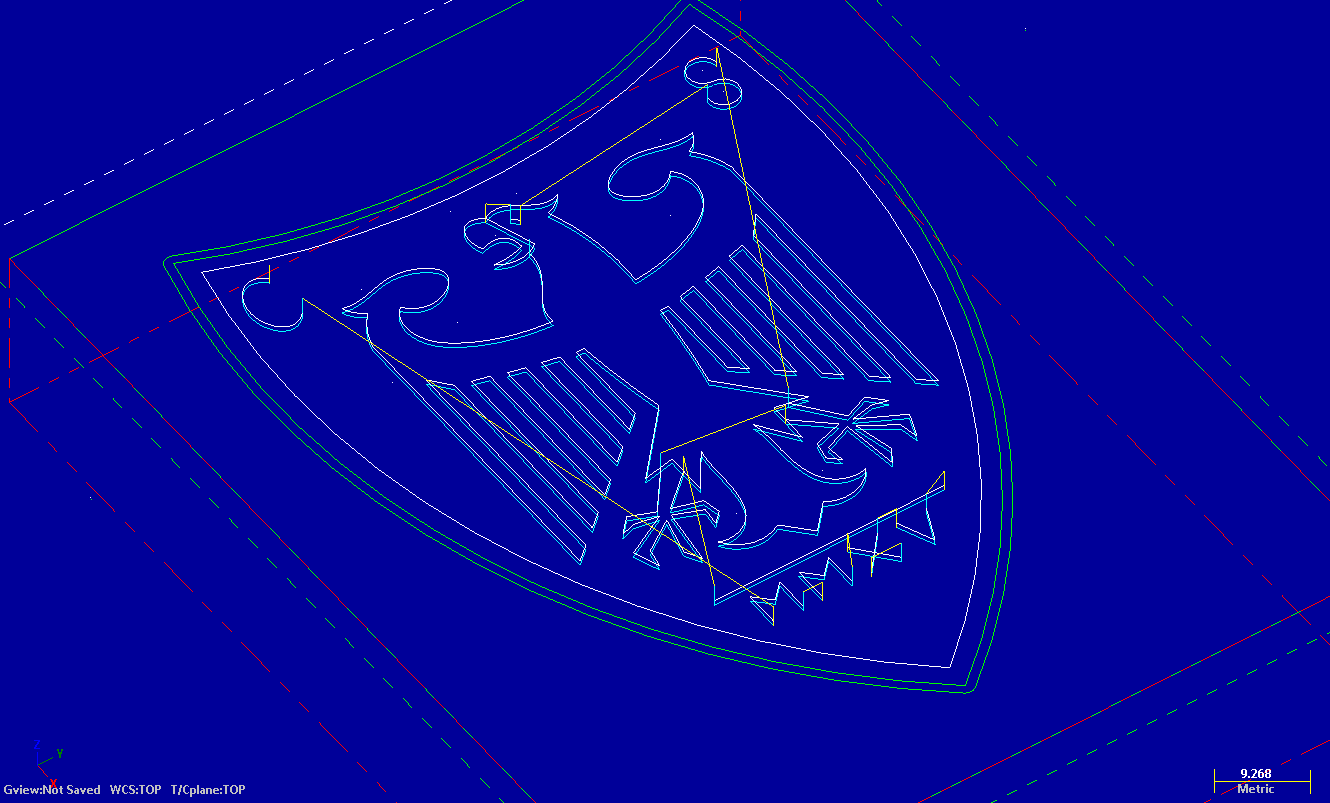
The engraving design, based off of the *Bundesadler* (the German federal eagle):
Once this was done, the model and toolpaths were converted to G-Code using a post-processor and off I went to the CNC mill. Here's what the finished product looks like:
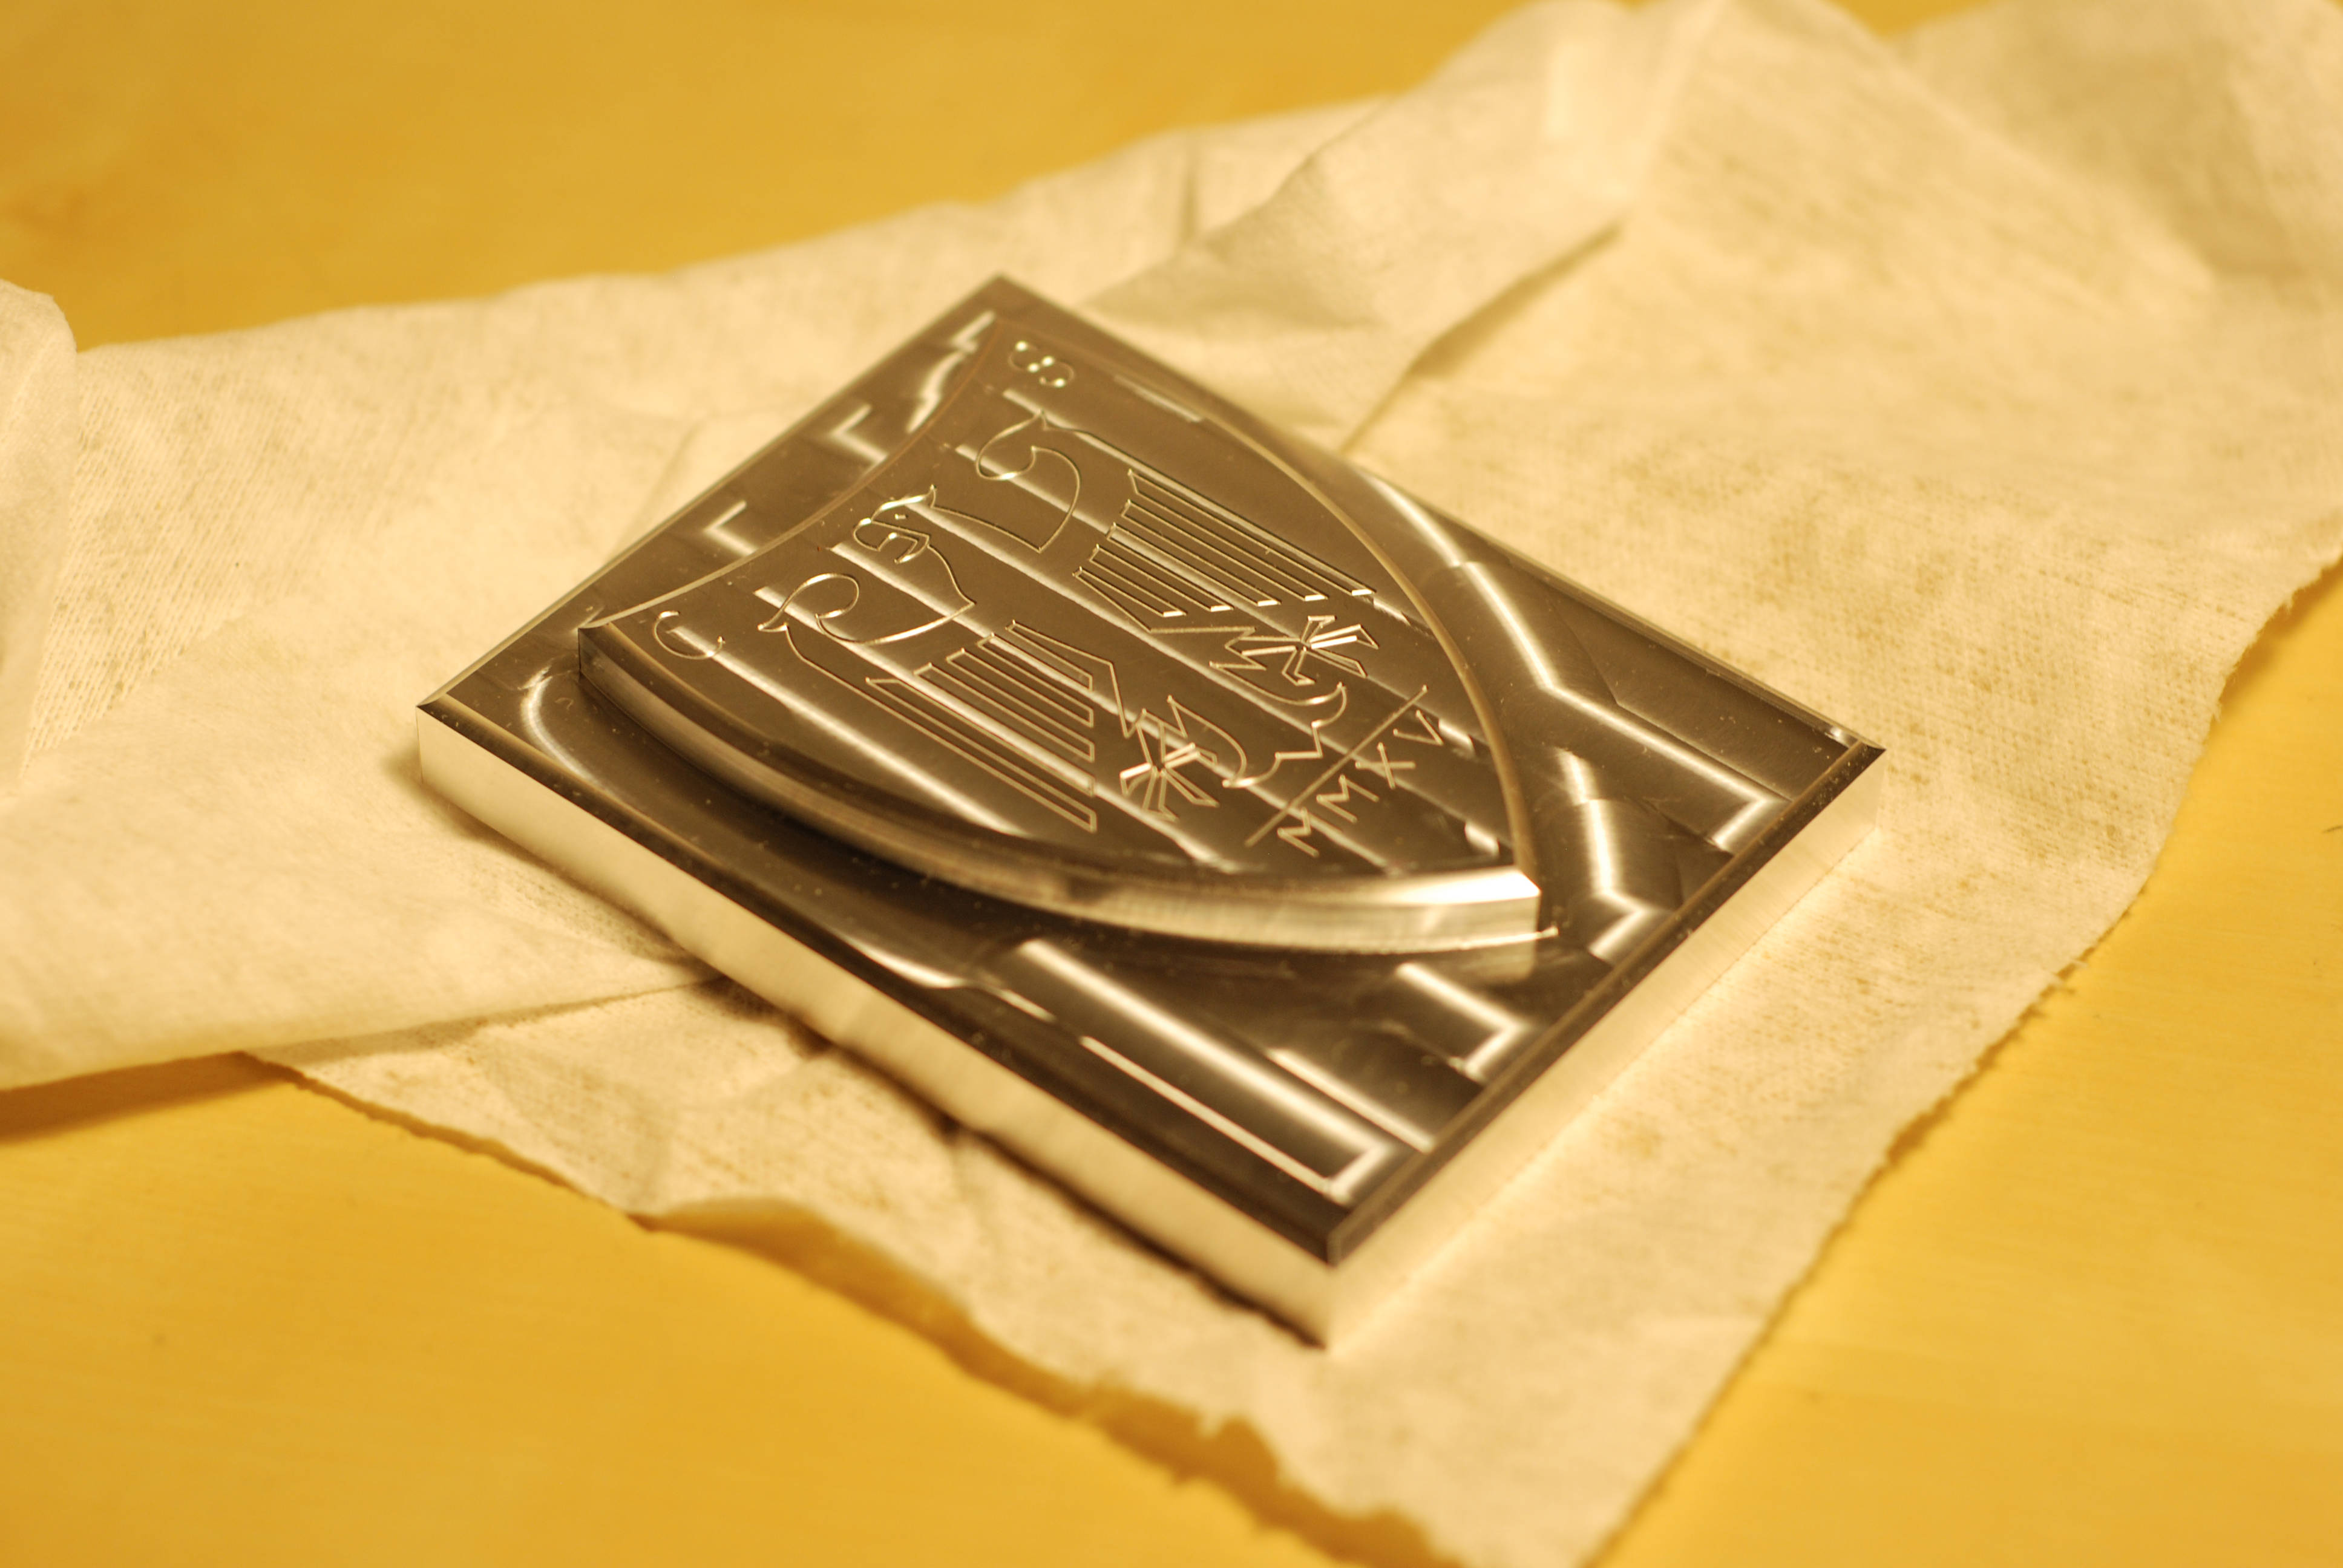
Overall, I'm pretty pleased with how it turned out, particularly the engraving, but in hindsight I should have put more thought into the toolpath for the facing on the floor (around the crest). The zigzag pattern didn't turn out as well as I had hoped and there were slight cusps from the stepover percentage I used. Live and learn.
